Introduction and Project Overview
What if I told you that you could build your own version of PostHog or Mixpanel in just a weekend? That’s exactly what I did with SmolHog - and through this blog, I’m going to share why I built it, how it works, and why you should care.
The Why
Every developer has used Google Analytics or Mixpanel, but have you ever wondered what’s actually happening under the hood? When your app sends an event, where does it go? How does it get processed? How do those beautiful dashboards get their data in real-time?
Building SmolHog has been an incredible journey into system design patterns, event-driven architectures, and real-time data processing. There’s no better way to understand how these systems work than building one yourself!
Tech Stack
| Technology | Purpose |
|---|---|
| Typescript/Express | API Gateway |
| Flutter/ Dart | Flutter SDK |
| Python/ FastAPI | Event Processor |
| PostgreSQL | Database |
| RabbitMQ | Message Broker |
| NextJS | Analytics Dashboard (Client Side) |
| Jaeger | Tracing |
| Prometheus | Monitoring |
| Grafana & Loki | Dashboard & Logs (System Infra) |
| Docker | Containerization |
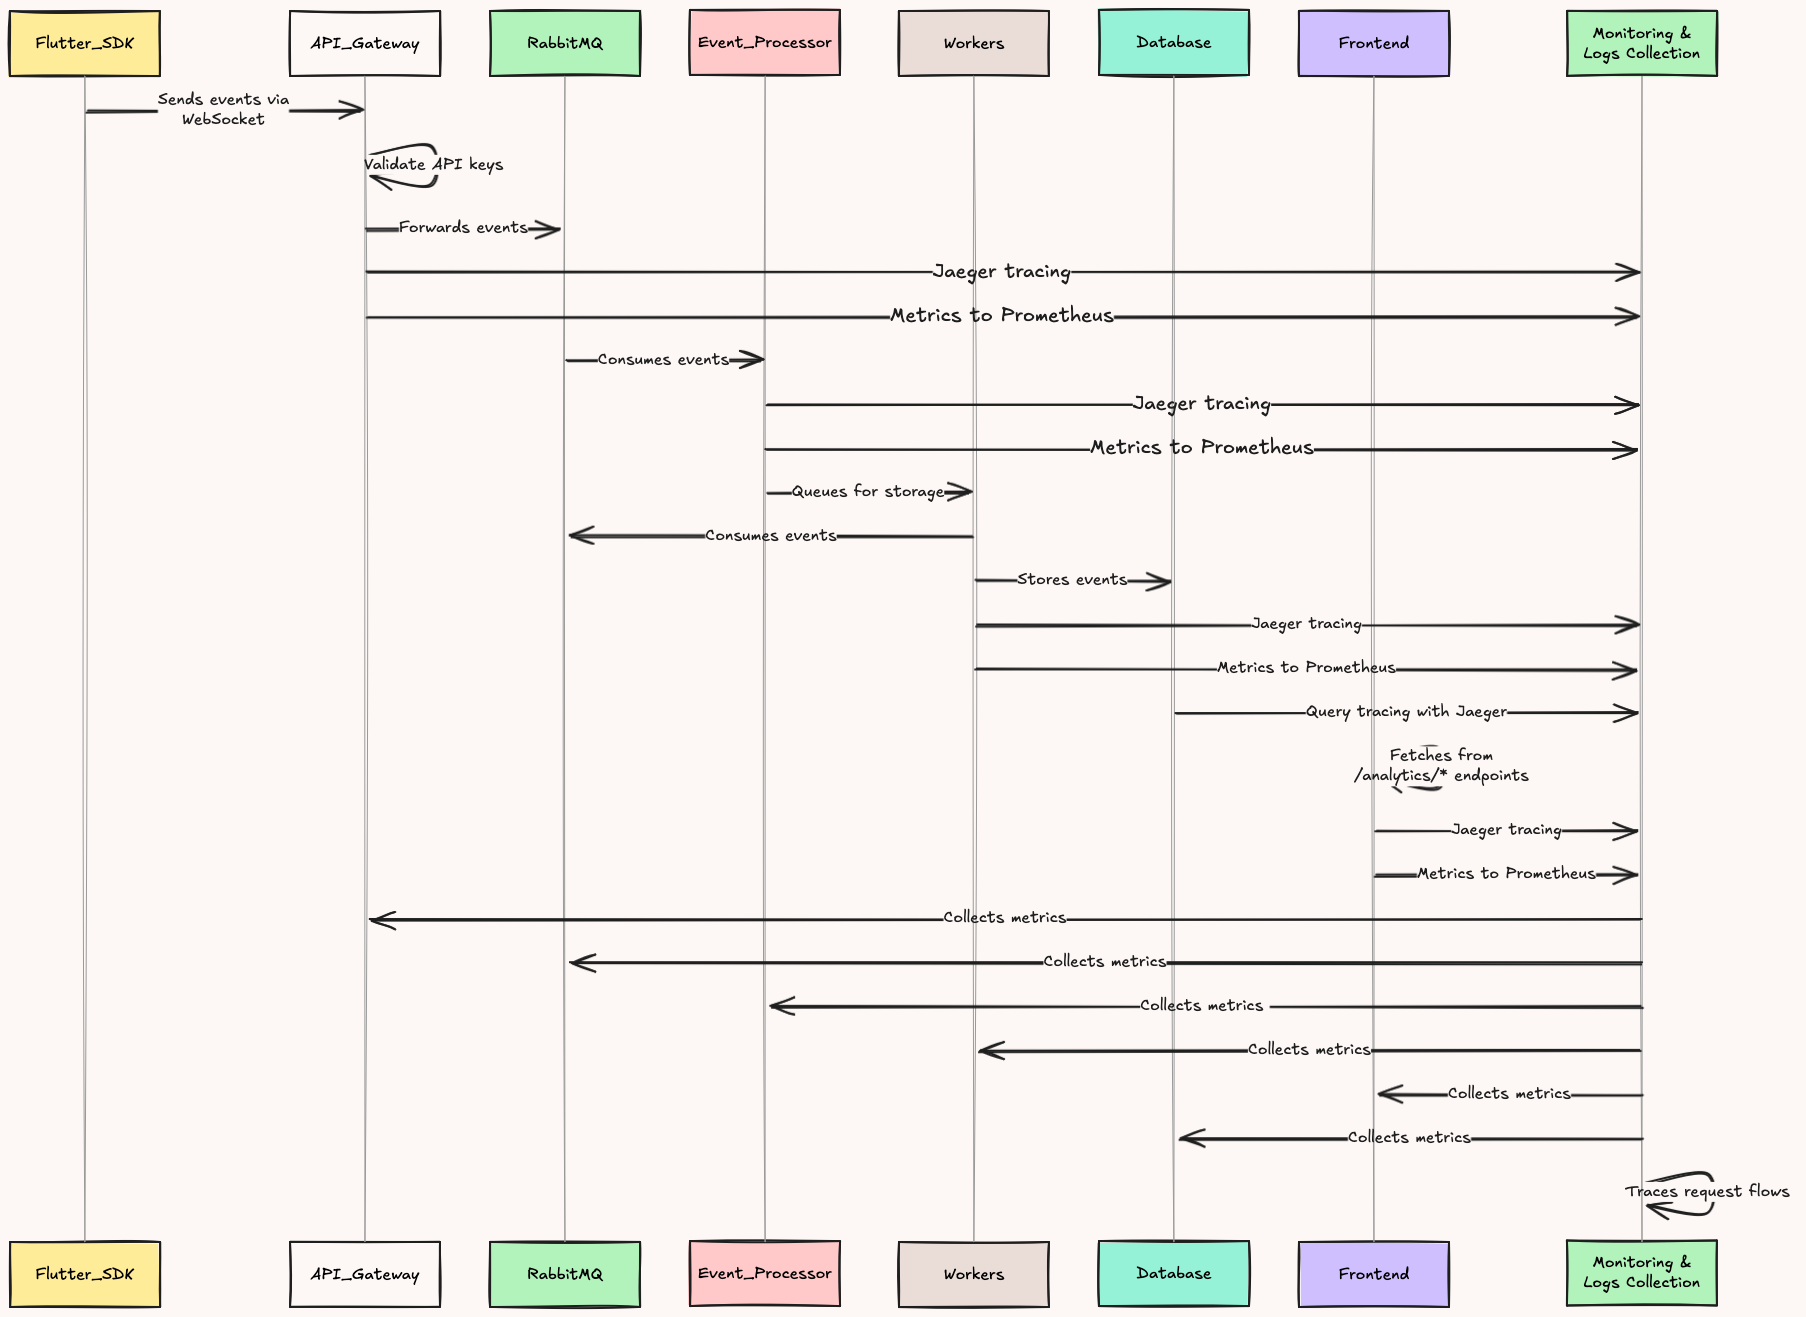
10,000 feet perspective

Key Components
Flutter SDK
- Source of telemetry/events generated by client applications.
- Sends events over WebSocket to the backend API gateway.
API Gateway
- Entry point for incoming traffic.
- Validates API keys to enforce authentication/authorization.
- Forwards valid events into the message broker for asynchronous processing.
- Exposes tracing (via Jaeger) and metrics (via Prometheus).
RabbitMQ (Message Broker)
- Provides asynchronous decoupling between ingestion and processing.
- Events are queued for consumption by downstream processors.
Event Processor
- Consumes queued events from RabbitMQ.
- Performs enrichment, transformation, or filtering.
- Queues processed events for storage.
- Reports tracing and metrics.
Workers
- Specialized background workers consume processed events.
- Handle persistence and business-specific logic.
Database
- Storage backend for processed events.
- Supports query execution for analytics endpoints.
Frontend
- Provides analytics dashboards and APIs.
- Queries traces from Jaeger and metrics from Prometheus.
- Fetches data from /analytics/* endpoints backed by the database.
- Monitoring & Logs Collection
- Central observability layer.
- Collects metrics from all components.
- Aggregates traces across request flows.
- Provides visibility into latency, throughput, and error rates.
Key Features
-
Event Tracking SmolHog can track any user interaction - clicks, page views, form submissions - with custom properties for detailed analysis.
-
User Identification Connect events to specific users and track their journey through your application over time.
-
Real-time Dashboard See events as they happen with a 10-second refresh interval (with plans to upgrade to WebSockets for true real-time updates).
-
Custom Event Properties Attach any properties to your events for deeper analysis and segmentation.
-
Time-Series Analysis Track event distribution over time to identify patterns and trends.
-
Cross-Platform SDK Currently supports Flutter, with a clean, easy-to-use API.
Stay tuned for more technical deep dives into specific components of SmolHog in future blog posts!
Till then Happy Coding.